![[등록] 2026-09-01 15:48:31](/support/_updata/banner2/tl181982910_6749.png)


Which Home Trading System (HTS) or Mobile Trading System (MTS) do you use when trading stocks? Let's check the daily price quotes for Peptron on your current HTS or MTS. The closing price for October 7 will likely be displayed as 96,900 KRW, with a fluctuation rate of -25.80%. In some securities firms' systems, the closing price may appear as 97,000 KRW.
What about the following day, October 8? The closing price is listed as 91,500 KRW, and the fluctuation rate is shown as -29.94%. Compared to the October 7 closing price of 96,900 KRW, this represents a 5.57% decline. Yet, the fluctuation rate reads -29.94%. If the price had dropped by 29.94% from 96,900 KRW, it should be approximately 67,900 KRW. This is a massive gap from the actual closing price of 91,500 KRW. What is going on here? Why does the fluctuation rate register as -29.94% when the price only fell 5.57% from the previous day's close?
The reason lies in a mismatch: the closing price is displayed based on the Korea Exchange (KRX) after-hours market close, while the fluctuation rate is calculated against the previous day's regular market close. Peptron's regular market closing price at 3:30 PM on October 7 was 130,600 KRW. However, as the stock plummeted after the regular session closed, it finished the 8:00 PM after-hours trading at 96,900 KRW. On that day, Peptron announced after the regular market close that its "Smart Depot" platform technology evaluation contract with Eli Lilly had expired, triggering a post-market crash.
Changing Calculation Standards
The core issue is that while October 7’s closing price is shown as the after-hours price of 96,900 KRW, the next day's fluctuation rate continues to be calculated based on the regular market close of 130,600 KRW. Consequently, even though the October 8 closing price of 91,500 KRW is only 5.57% lower than the previous day's after-hours close, the screen indicates a 29.94% plunge relative to the regular market close.
The bigger problem is that it is difficult to find Peptron's regular market closing price of 130,600 KRW for October 7 on standard daily price screens. To figure out the previous day's regular close, investors must reverse-calculate it using the current stock price and fluctuation rate. Alternatively, they must check the price at 3:30 PM on the minute-by-minute chart or log into the KRX Information Data System. In the past, checking the previous day's close on an HTS or MTS was effortless; now, it requires jumping through extra hoops.
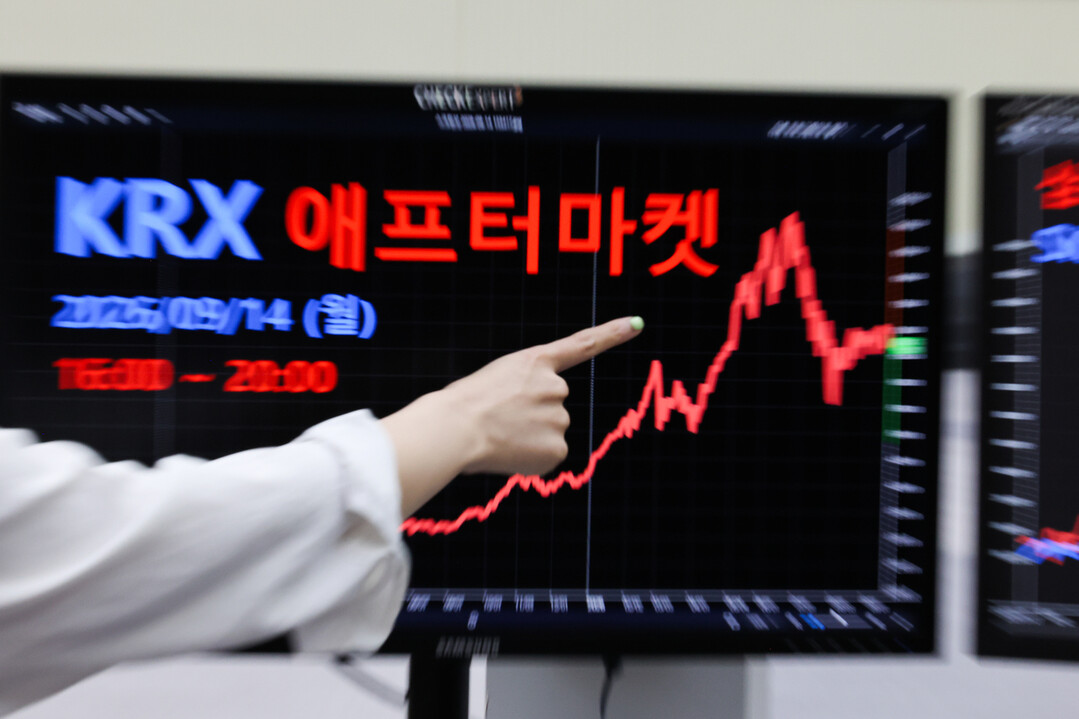
This confusion has persisted since the KRX after-hours market was introduced on September 14. Replacing the traditional single-price auction method after the regular session, a real-time trading system was implemented, enabling trading from 4:00 PM to 8:00 PM. As a result, some HTS and MTS platforms now substitute the 3:30 PM regular market close with the after-hours close. While historical daily charts and quotes used to display only the regular close—making after-hours prices hard to find—it has now become equally cumbersome to verify the regular market close.
Charts Show a 12.5% Surge, but the Fluctuation Rate Reads -10%
The inconvenience goes far beyond merely checking the previous day's close. Many retail investors rely on technical indicators such as moving averages, the Relative Strength Index (RSI), and the Moving Average Convergence Divergence (MACD). However, if daily charts reflect after-hours closing prices instead of regular market closes, the values of these technical indicators can be significantly distorted.
For instance, moving averages might capture sudden after-hours price swings, making it look as though a short-term trend has broken down sharply. This directly impacts trading strategies built around moving averages. Oscillators like the RSI or Stochastic may generate altered oversold signals, and interpreting divergences—where the stock price and indicator move in opposite directions—using the MACD risks severe confusion.
It would at least maintain consistency if the next day's fluctuation rate were also calculated from the previous day's after-hours closing price. However, because the closing price and fluctuation rate displayed on charts follow different standards, investors are forced to interpret indicators by reconciling two conflicting metrics. In cases where a stock experiences extreme volatility in the after-hours market, like Peptron, applying technical trading strategies originally designed for regular market closes becomes nearly impossible.
Confusion also spills over into the next day's regular market opening price. Suppose a stock's regular market close yesterday was 50,000 KRW, and its after-hours close was 40,000 KRW. What happens if the regular market opens at 45,000 KRW the following day?
On the chart, it looks like a sharp 12.5% surge from yesterday's closing price of 40,000 KRW. Yet, the actual fluctuation rate is displayed as -10% because it is calculated against yesterday's regular market close of 50,000 KRW. Just looking at the chart gives the illusion that the stock is soaring, when in reality, it has dropped significantly compared to the official regular close. Such optical illusions sow confusion in investors' decision-making. While it might make a great midterm exam question for someone who teaches finance at a university like the author, it is a deeply perplexing situation for everyday investors.
Another concern is the widening gap in information accessibility between retail investors and institutional/foreign investors. Retail investors primarily rely on brokerage HTS and MTS platforms, whereas institutional and foreign players utilize professional financial information terminals like Bloomberg Terminals or Yonhap Infomax, which clearly distinguish between regular and after-hours closing prices. Meanwhile, some retail platforms fail to display the previous day's regular close separately, leaving users struggling to find vital information.
If investors experience disparities in information access despite participating in the same market, it can inevitably undermine retail investor trust in the domestic stock market. Recently, South Korean retail investors' holdings of U.S. stocks surpassed 200 billion USD (approx. 267.36 trillion KRW). At a time when interest in overseas equities is surging, making domestic trading systems even more inconvenient will only accelerate investor flight. In an environment where basic price data requires a scavenger hunt to find, bolstering confidence in the domestic market will remain an uphill battle.
[Copyright (c) Global Economic Times. All Rights Reserved.]